Performance Profiling
Atmos provides comprehensive performance profiling capabilities through two complementary approaches: a lightweight
interactive heatmap for quick performance insights, and deep pprof integration for detailed runtime analysis.
Profiling Approaches
Atmos offers two methods for performance analysis, each suited to different use cases:
Performance Heatmap (Quick Analysis)
A lightweight, built-in visualization tool that provides real-time performance metrics with minimal overhead:
- Function-level metrics: Call counts, execution times, and percentile statistics
- Interactive visualization: Multiple display modes (bar charts, sparklines, tables)
- Zero setup: Single CLI flag (
--heatmap) enables tracking - Microsecond precision: Captures fast function executions
- Best for: Quick performance checks, development workflow, identifying hot paths
pprof Profiling (Deep Analysis)
Go's comprehensive profiling toolkit for detailed runtime performance analysis:
- Multiple profile types: CPU, memory (heap/allocs), goroutines, blocking, mutex contention
- Line-level profiling: Pinpoint exact code locations
- Flame graphs: Visual call stack analysis
- Persistent data: Export profiles for historical comparison
- Best for: Deep performance investigation, memory leak detection, production debugging
Performance Heatmap
Quick Start
Display the performance heatmap after any Atmos command:
# Run any Atmos command with the --heatmap flag
atmos describe stacks --heatmap
This launches an interactive TUI (Terminal User Interface) where you can switch between visualization modes by pressing 1-3.
Real-World Example
Here's actual output from atmos describe stacks --heatmap:
Interactive Mode (when running in a terminal with TTY):
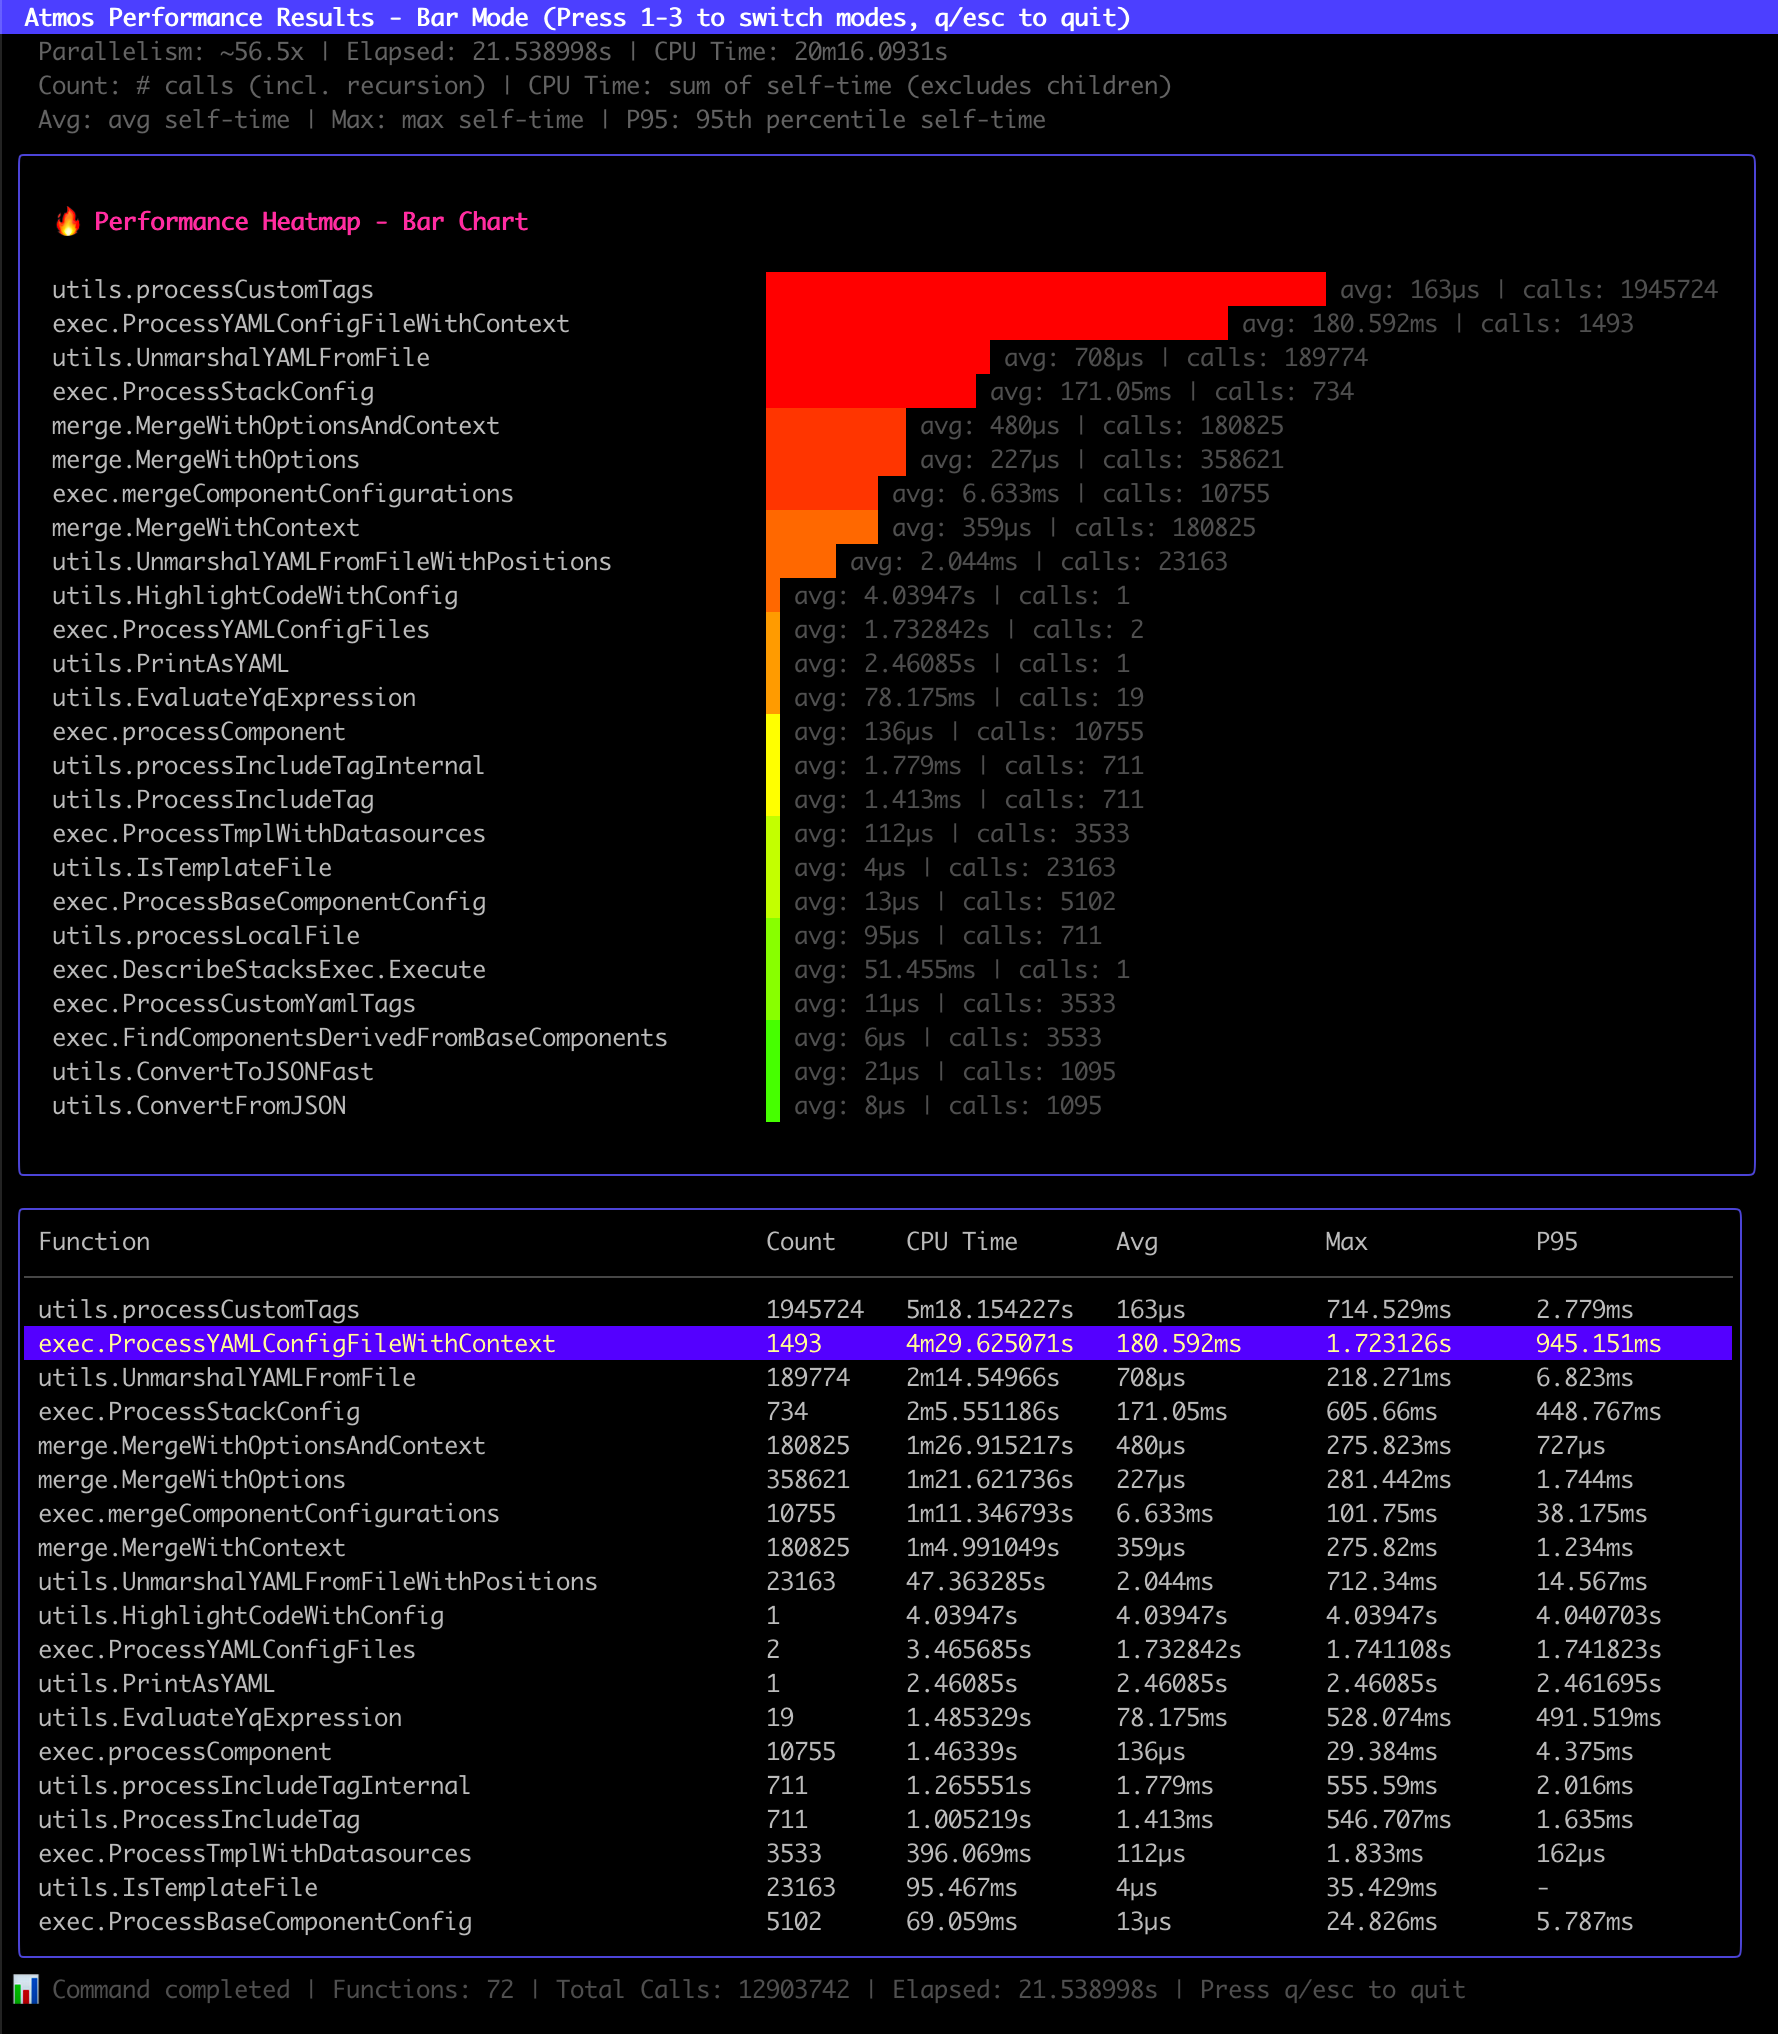
The interactive TUI shows the top 25 functions with color-coded bars representing total CPU time. Each function displays its average execution time per call alongside the total number of calls, making it easy to identify both slow functions and high-frequency functions at a glance.
Example Interactive Display:
🔥 Performance Heatmap - Bar Chart

utils.processCustomTags           ████████████████████████████████████████ avg: 0.37ms | calls: 447586
exec.ProcessYAMLConfigFile        ████████████████████████████████ avg: 686µs | calls: 199
utils.UnmarshalYAMLFromFile       █████████████████ avg: 82µs | calls: 53429
- Bar length: Proportional to total CPU time (shows overall impact on performance)
- avg: Average self-time per call (shows typical function performance)
- calls: Number of times the function was invoked
Interactive TUI Legend:
The TUI displays a comprehensive legend at the top showing performance summary and metric descriptions:
Parallelism: ~0.9x | Elapsed: 279.002ms | CPU Time: 255.378ms
Count: # calls (incl. recursion) | CPU Time: sum of self-time (excludes children)
Avg: avg self-time | Max: max self-time | P95: 95th percentile self-time
- Line 1: Live performance metrics for this execution (Parallelism, Elapsed time, Total CPU time)
- Line 2: Explanation of Count and CPU Time columns
- Line 3: Explanation of statistical timing columns (Avg, Max, P95)
Non-Interactive Mode (CI/CD, scripts, or redirected output):
Visualization Modes
The heatmap supports three visualization modes. In interactive mode, press 1-3 to switch:
1. Bar Chart (Default)
Horizontal bars with color gradient showing relative total CPU time:
atmos describe stacks --heatmap --heatmap-mode=bar
- Bar length: Proportional to total CPU time (overall performance impact)
- Display format: Shows
avg: Xms | calls: Nfor each function - Color gradient: Red (highest impact) → Green (lowest impact)
- Best for: Quick identification of both slow functions and high-impact functions
- Example:
utils.processCustomTags ████████ avg: 0.37ms | calls: 447586
2. Sparkline Mode
Compact sparkline charts showing relative average execution times:
atmos describe stacks --heatmap --heatmap-mode=sparkline
- Sparkline height: Proportional to average self-time per call
- Display format: Shows
avg: Xms | calls: Nfor each function - Compact view: See more functions in less vertical space
- Best for: Quick pattern recognition and comparing many functions at once
- Example:
utils.processCustomTags ▇▇▇▇▇▇▇▇▇▇ avg: 0.37ms | calls: 447586
3. Table Mode
Detailed tabular view with all metric columns (top 50 rows):
atmos describe stacks --heatmap --heatmap-mode=table
- All metric columns (Count/CPU Time/Avg/Max/P95)
- Shows top 50 functions by CPU time
- Best for detailed analysis
Understanding Metrics
Performance Summary:
=== Atmos Performance Summary ===
Elapsed: 234.56ms | CPU Time: 185.32ms | Parallelism: ~0.8x
Functions: 12 | Total Calls: 156
- Elapsed: Total wall-clock execution time for the command
- CPU Time: Sum of all self-times (actual CPU work done, excludes time spent in child functions)
- Parallelism: CPU Time ÷ Elapsed time ratio (greater than 1.0 = parallel execution, less than 1.0 = single-threaded)
- Functions: Number of unique functions tracked
- Total Calls: Total number of function calls tracked
Function Metrics:
Function- Name of the tracked function
Count- Number of times the function was called (includes all recursive calls)
CPU Time- Sum of self-time across all calls - total CPU work done by the function itself, excluding time spent in child function calls. This avoids double-counting in nested/recursive calls and accurately represents the total CPU time spent executing the function's own code.
Avg- Average self-time per call - actual work done in the function, excluding time spent in child function calls (SelfTime ÷ Count). This metric accurately represents the function's own execution time and is the best indicator for optimization opportunities.
Max- Maximum self-time for a single function call among ALL executions (excludes time spent in children). Critical for identifying performance outliers and worst-case scenarios. If a function is called 100 times with most calls taking ~10ms but one call took 500ms, Max will show 500ms - revealing intermittent issues like excessive work, algorithmic edge cases, or system resource contention affecting that specific call.
P95- 95th percentile of self-time latency - represents the self-time below which 95% of function calls complete. A consistent indicator of the function's own work performance, excluding time spent in child functions.
All timing columns use Self-Time: CPU Time, Avg, Max, and P95 all exclude time spent in child function calls, showing only the actual work done in the function itself. This avoids double-counting in nested/recursive calls.
CPU Time: Sum of self-time across all calls - represents total CPU work done by the function Avg: Average self-time per call (CPU Time ÷ Count) Max: Maximum self-time for any single call P95: 95th percentile of self-time across all calls
Example: If ProcessConfig is called 10 times and each call does 20ms of its own work (excluding 80ms spent in child functions):
- CPU Time: 200ms (10 calls × 20ms per call)
- Avg: 20ms (200ms ÷ 10 calls)
- Wall-Clock Time: Would be ~1000ms (10 × 100ms including children) - but this would double-count child execution time
Why CPU Time vs Wall-Clock? When functions call each other, summing wall-clock times counts the same work multiple times. CPU Time (sum of self-times) accurately represents total work without double-counting, making it possible to meaningfully compare the sum of all CPU Times to the command's elapsed time.
Parallelism Factor: The ratio of CPU Time to Elapsed time shows execution characteristics:
- ~0.8x: Single-threaded with some overhead
- ~1.0x: Perfect single-threaded execution
- Greater than 1.0x: Parallel execution across multiple cores (e.g., 4.0x = ~4 cores utilized)
Max is your outlier detector! It shows the slowest single execution among all calls to a function (excluding time spent in children).
Example - Spotting Intermittent Issues:
Function                Count    CPU Time  Avg       Max       P95
network.FetchRemote     100      1.2s      12ms      850ms     15ms
Analysis:
- Count: 100 calls total
- CPU Time: 1.2s total (sum of all self-times)
- Avg: 12ms average (typical performance)
- Max: 850ms (one call's own work took 71x longer!)
- P95: 15ms (95% of calls complete within 15ms)
Diagnosis: The large gap between Max (850ms) and P95 (15ms) reveals an intermittent performance issue affecting ~5% of calls. Since Max tracks self-time (excluding children), this indicates the function's own work was slow. Likely causes:
- Network timeout on one request (if function makes network calls)
- Disk I/O spike during that specific call
- CPU contention or system resource starvation
- GC pause occurred during execution
- Algorithmic edge case (e.g., processing unusually large input)
Action: Investigate why that specific call was 71x slower than average. Use --profile-file with pprof for deeper analysis.
Interactive Controls
Keyboard Shortcuts:
- ↑/↓: Move selection up/down (also k/j)
- 1: Switch to Bar Chart mode
- 2: Switch to Sparkline mode
- 3: Switch to Table mode
- q/esc: Quit and return to terminal
CLI Flags
--heatmap- Show performance heatmap visualization after command execution (includes P95 latency) (default:
false) --heatmap-mode- Heatmap visualization mode:
bar,sparkline,table(press 1-3 to switch in TUI) (default:bar)
Common Use Cases
Identifying Performance Bottlenecks:
# Track which functions consume the most time
atmos terraform plan large-component -s prod --heatmap

# Focus on functions with high CPU Time
Before/After Comparison:
# Baseline measurement
atmos describe stacks --heatmap 2>baseline.txt

# After optimization
atmos describe stacks --heatmap 2>optimized.txt

# Compare results
diff baseline.txt optimized.txt
CI/CD Integration:
# Capture performance in automated pipelines
atmos terraform plan vpc -s prod --heatmap 2>&1 | tee performance.log

# Parse for regression detection
Development Workflow:
# Create an alias for convenient usage
alias atmos-perf='atmos --heatmap'

# Use during development
atmos-perf validate stacks
atmos-perf describe component vpc -s dev
pprof Profiling
Overview
pprof is Go's standard profiling tool that captures detailed runtime performance data.
Profile Types:
- CPU Profile: Where your program spends CPU time
- Heap Profile: Current heap memory allocation patterns
- Allocs Profile: All memory allocations since program start
- Goroutine Profile: Active goroutines and call stacks
- Block Profile: Operations blocking on synchronization
- Mutex Profile: Lock contention patterns
- Thread Create Profile: Stack traces leading to thread creation
- Trace Profile: Detailed execution traces for analysis
File-Based Profiling
Capture profiles directly to a file - ideal for CLI tools:
# CPU profiling (default)
atmos terraform plan vpc -s plat-ue2-dev --profile-file=cpu.prof

# Memory heap profiling
atmos terraform plan vpc -s plat-ue2-dev --profile-file=heap.prof --profile-type=heap

# Execution trace profiling
atmos terraform plan vpc -s plat-ue2-dev --profile-file=trace.out --profile-type=trace

# Goroutine profiling
atmos terraform plan vpc -s plat-ue2-dev --profile-file=goroutine.prof --profile-type=goroutine
Server-Based Profiling
Start an HTTP server for interactive profiling:
atmos terraform plan vpc -s plat-ue2-dev --profiler-enabled
Access different profiles through HTTP endpoints:
# CPU profile (30-second sample)
go tool pprof http://localhost:6060/debug/pprof/profile

# Memory allocation profile
go tool pprof http://localhost:6060/debug/pprof/heap

# Goroutine profile
go tool pprof http://localhost:6060/debug/pprof/goroutine

# Web interface
open http://localhost:6060/debug/pprof/
Configuration
CLI Flags:
--profile-file- Write profiling data to file instead of starting server
--profile-type- Type of profile to collect when using
--profile-file. Options:cpu,heap,allocs,goroutine,block,mutex,threadcreate,trace(default:cpu) --profiler-enabled- Enable pprof profiling server (default:
false) --profiler-host- Host for pprof profiling server (default:
localhost) --profiler-port- Port for pprof profiling server (default:
6060)
Environment Variables:
ATMOS_PROFILER_ENABLED- Enable pprof profiling server
ATMOS_PROFILER_HOST- Host address for profiling server
ATMOS_PROFILER_PORT- Port for profiling server
ATMOS_PROFILE_FILE- File path for file-based profiling
ATMOS_PROFILE_TYPE- Profile type for file-based profiling
Configuration File:
Configuration Precedence:
- Command-line flags (highest priority)
- Environment variables
- Configuration file (
atmos.yaml) - Default values (lowest priority)
Analyzing Profiles
CPU and Memory Profiles:
# Interactive text mode
go tool pprof cpu.prof
go tool pprof heap.prof

# Web interface (requires Graphviz: brew install graphviz)
go tool pprof -http=:8080 cpu.prof
go tool pprof -http=:8080 heap.prof

# Direct text output
go tool pprof -top cpu.prof
go tool pprof -top heap.prof
Trace Profiles:
# Use go tool trace for execution traces
go tool trace trace.out

# Opens web interface showing:
# - Timeline view of goroutines
# - Network blocking profile
# - Synchronization blocking profile
# - System call blocking profile
Understanding pprof Data:
- flat: Time spent in the function itself
- cum: Cumulative time (function + callees)
- flat%: Percentage of total execution time
- sum%: Cumulative percentage up to this function
Focus optimization on functions with high flat time and flat%.
Common Scenarios
Performance Optimization:
# Profile CPU usage in slow operations
atmos terraform plan large-component -s prod --profile-file=slow-plan.prof --profile-type=cpu

# Profile memory usage
atmos terraform plan large-component -s prod --profile-file=memory.prof --profile-type=heap

# Profile detailed execution
atmos terraform plan large-component -s prod --profile-file=trace.out --profile-type=trace

# Analyze results
go tool pprof -http=:8080 slow-plan.prof
go tool pprof -http=:8080 memory.prof
go tool trace trace.out
Memory Analysis:
# File-based memory profiling
atmos describe stacks --profile-file=heap.prof --profile-type=heap
atmos describe stacks --profile-file=allocs.prof --profile-type=allocs

# Analyze
go tool pprof -http=:8080 heap.prof
go tool pprof -http=:8080 allocs.prof

# Server-based memory profiling
atmos describe stacks --profiler-enabled

# In another terminal
go tool pprof http://localhost:6060/debug/pprof/heap
go tool pprof http://localhost:6060/debug/pprof/allocs
Custom Server Configuration:
atmos terraform apply vpc -s prod \
  --profiler-enabled \
  --profiler-host=0.0.0.0 \
  --profiler-port=8060
Choosing the Right Tool
| Feature | Performance Heatmap | pprof Profiling |
|---|---|---|
| Overhead | Minimal (microsecond tracking) | Higher (full runtime instrumentation) |
| Granularity | Function-level metrics | Line-level profiling |
| Setup | CLI flag only (--heatmap) | Requires flags or config |
| Output | Real-time visualization | File or HTTP endpoint |
| Use Case | Quick performance checks | Deep performance analysis |
| Visualization | Built-in interactive UI | Requires go tool pprof |
| Data Retention | In-memory (command lifetime) | Persistent files |
| Profile Types | Function timing only | CPU, memory, goroutines, blocking, etc. |
Use Performance Heatmap when:
- Validating performance during development
- Identifying which functions are called most
- Comparing execution times between commands
- Need quick insights without external tools
- Monitoring lightweight operations
Use pprof Profiling when:
- Deep diving into performance bottlenecks
- Analyzing CPU and memory usage patterns
- Investigating memory leaks
- Profiling goroutines and lock contention
- Need flame graphs and detailed visualizations
- Historical comparison across runs
Use Both Together:
# Combine for comprehensive analysis
atmos terraform plan vpc -s prod \
  --heatmap \
  --profile-file=cpu.prof \
  --profile-type=cpu

# View quick heatmap summary
# Then deep dive with pprof
go tool pprof -http=:8080 cpu.prof
Dependencies
Graphviz (Optional for pprof)
The pprof web interface requires Graphviz for visual graphs:
macOS:
brew install graphviz
Ubuntu/Debian:
sudo apt-get install graphviz
CentOS/RHEL:
sudo yum install graphviz
Without Graphviz, text-based pprof analysis still works.
Best Practices
File-Based vs Server-Based (pprof)
- Use file-based profiling for most CLI operations and performance analysis
- Use server-based profiling for long-running operations or interactive profiling
- Supports all profile types:
cpu,heap,allocs,goroutine,block,mutex,threadcreate,trace
Performance Heatmap Usage
- Enable only when needed: Zero overhead when not using
--heatmapflag - Use appropriate modes:
barfor quick comparison,tablefor detailed analysis - Combine with logging: Correlate performance with debug logs
- Automate in CI/CD: Track performance regressions in pipelines
Profile Regularly
- Profile before and after optimizations
- Establish baseline profiles for typical operations
- Profile different stack sizes and complexity levels
- Compare heatmap metrics for quick validation, pprof for deep analysis
Security Considerations
- Server-based profiling exposes runtime information through HTTP
- Use
localhostbinding in production environments - Disable profiling in production unless actively debugging
- Performance heatmap is safe (in-memory only, no network exposure)
Troubleshooting
Performance Heatmap Issues
Heatmap Not Showing:
# Ensure you're using the latest Atmos version
atmos version --heatmap
No Functions Tracked:
- Performance tracking is added incrementally
- Run commands that process stacks/components for more data:
atmos describe stacks --heatmap
atmos terraform plan component -s stack --heatmap
P95 Shows Zero:
- P95 requires multiple calls to be meaningful
- Run commands that execute functions multiple times
Interactive Mode Not Working:
- Requires TTY (terminal)
- In scripts/CI/CD, static summary is displayed instead:
⚠️ No TTY available for interactive visualization. Summary displayed above.
pprof Issues
Profile File Creation Errors:
# Ensure directory exists
mkdir -p /path/to/profile/
atmos command --profile-file=/path/to/profile/cpu.prof --profile-type=cpu
Invalid Profile Type:
# Check supported types
echo "Supported: cpu, heap, allocs, goroutine, block, mutex, threadcreate, trace"
atmos command --profile-file=profile.out --profile-type=heap
Graphviz Not Found:
# Use text-based analysis instead
go tool pprof -top cpu.prof
go tool pprof -list=functionName cpu.prof
Server Already Running:
# Use different port
atmos command --profiler-enabled --profiler-port=7070
Examples
Development Workflow
# Quick performance check with heatmap
atmos describe stacks --heatmap

# Deep analysis with pprof if issues found
atmos describe stacks --profile-file=cpu.prof
go tool pprof -http=:8080 cpu.prof
CI/CD Integration
#!/bin/bash
# ci-performance-check.sh

# Run with heatmap for quick metrics
atmos validate stacks --heatmap 2>&1 | tee perf-output.txt

# Extract elapsed time
elapsed=$(grep "Elapsed:" perf-output.txt | awk '{print $2}')

# Check for regression (e.g., > 500ms)
if [ $(echo "$elapsed > 500" | bc) -eq 1 ]; then
  echo "Performance regression: ${elapsed} > 500ms"
  # Deep profile for investigation
  atmos validate stacks --profile-file=cpu.prof --profile-type=cpu
  exit 1
fi
Combined Analysis
# Use both tools for comprehensive analysis
atmos terraform plan large-stack -s prod \
  --heatmap \
  --heatmap-mode=bar \
  --profile-file=analysis.prof \
  --profile-type=cpu \
  2>&1 | tee combined-analysis.log

# View heatmap summary immediately
# Then analyze with pprof
go tool pprof -http=:8080 analysis.prof
Related Documentation
- Error Messages - Common error messages and solutions

